
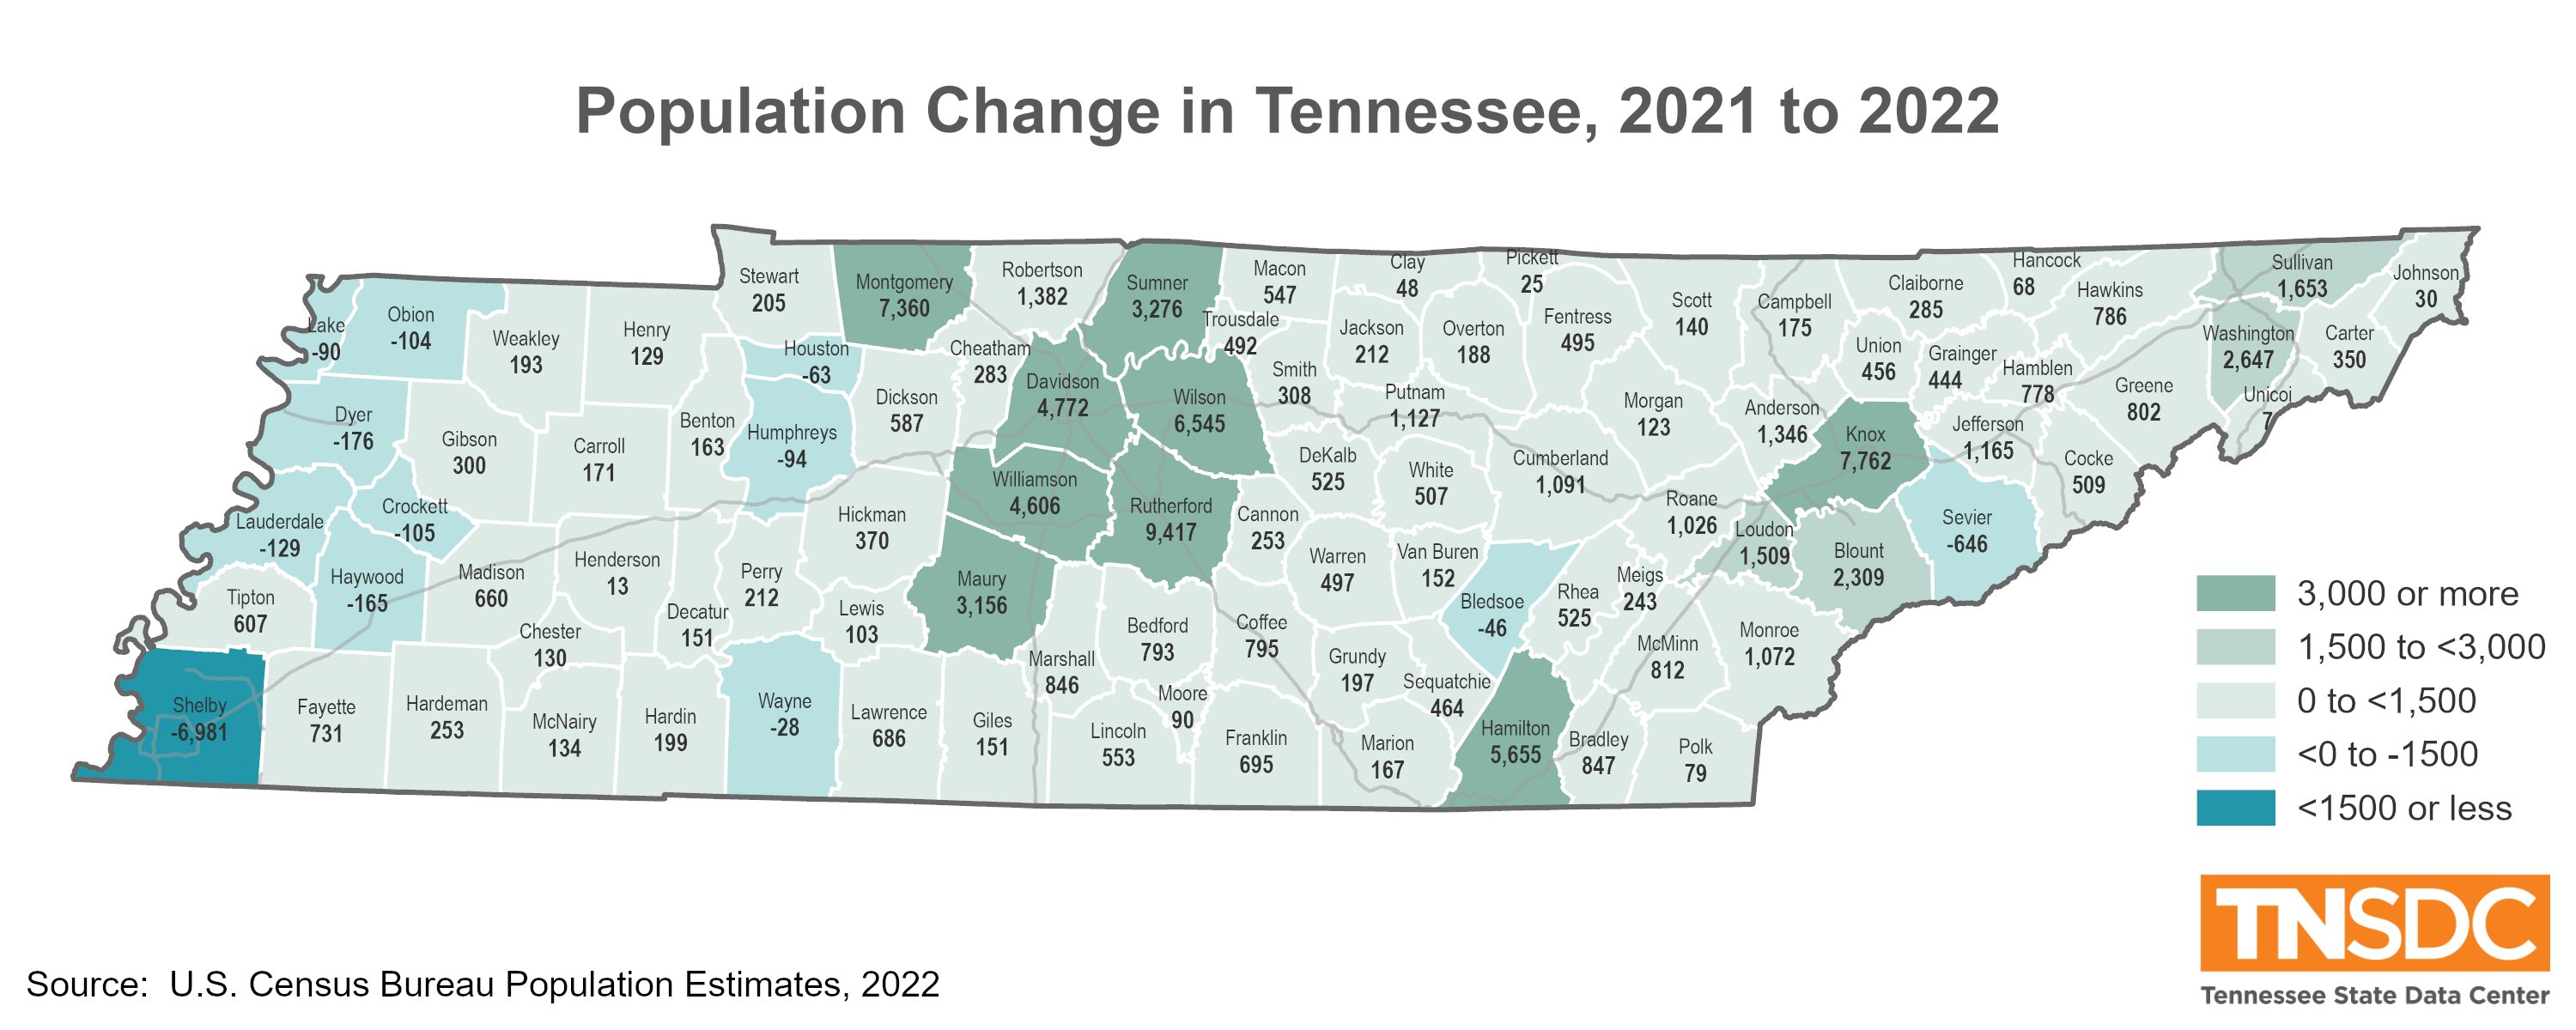
Record levels of net domestic migration pushed Tennessee’s population up by 83,000 people in 2022. New county-level data shows that resulted in widespread gains across the state.
Rutherford County’s run continues. Since 2016, the Middle Tennessee county located southeast of Nashville has led the state with the largest annual population increases every year. In 2022, it added an estimated 9,417 new residents, a 2.7 percent one-year increase.
That is according to 2022 Population Estimates released on March 30, 2023, by the U.S. Census Bureau.
It joined other suburban Nashville counties to score large gains again last year. That includes Wilson (+6,545), Williamson (+4,606) and Sumner (3,276). Nashville-Davidson County rebounded from a reported 12,700-person population decrease in 2021 to add 4,772 new residents in 2022.
| County | 2021 Population | 2022 Population | Change |
|---|---|---|---|
| Rutherford | 351,202 | 360,619 | 9,417 |
| Knox | 486,812 | 494,574 | 7,762 |
| Montgomery | 227,841 | 235,201 | 7,360 |
| Wilson | 152,010 | 158,555 | 6,545 |
| Hamilton | 369,027 | 374,682 | 5,655 |
| Davidson | 703,372 | 708,144 | 4,772 |
| Williamson | 256,209 | 260,815 | 4,606 |
| Sumner | 200,582 | 203,858 | 3,276 |
| Maury | 105,003 | 108,159 | 3,156 |
| Washington | 133,525 | 136,172 | 2,647 |
Source: Vintage 2022 Population Estimates, U.S. Census Bureau, 2023
The central county in several other Tennessee metros also ranked among the state’s top-growing counties last year.
Knox County’s total increase of 7,762 people was the second most growth in the state last year. Nearly all of the county’s population increase was from net domestic migration, which totaled 7,500 more people moving into the area than moved out (Figure 2).
Other metros in the eastern third of the state also had a strong year. Hamilton County (Chattanooga) added 5,655 new residents. Washington County’s (Johnson City) surge of 2,647 new residents in 2022 came after averaging less than a 700-person annual increase over the past 10 years. Growth in these two areas was also propelled by sizeable domestic migration gains.
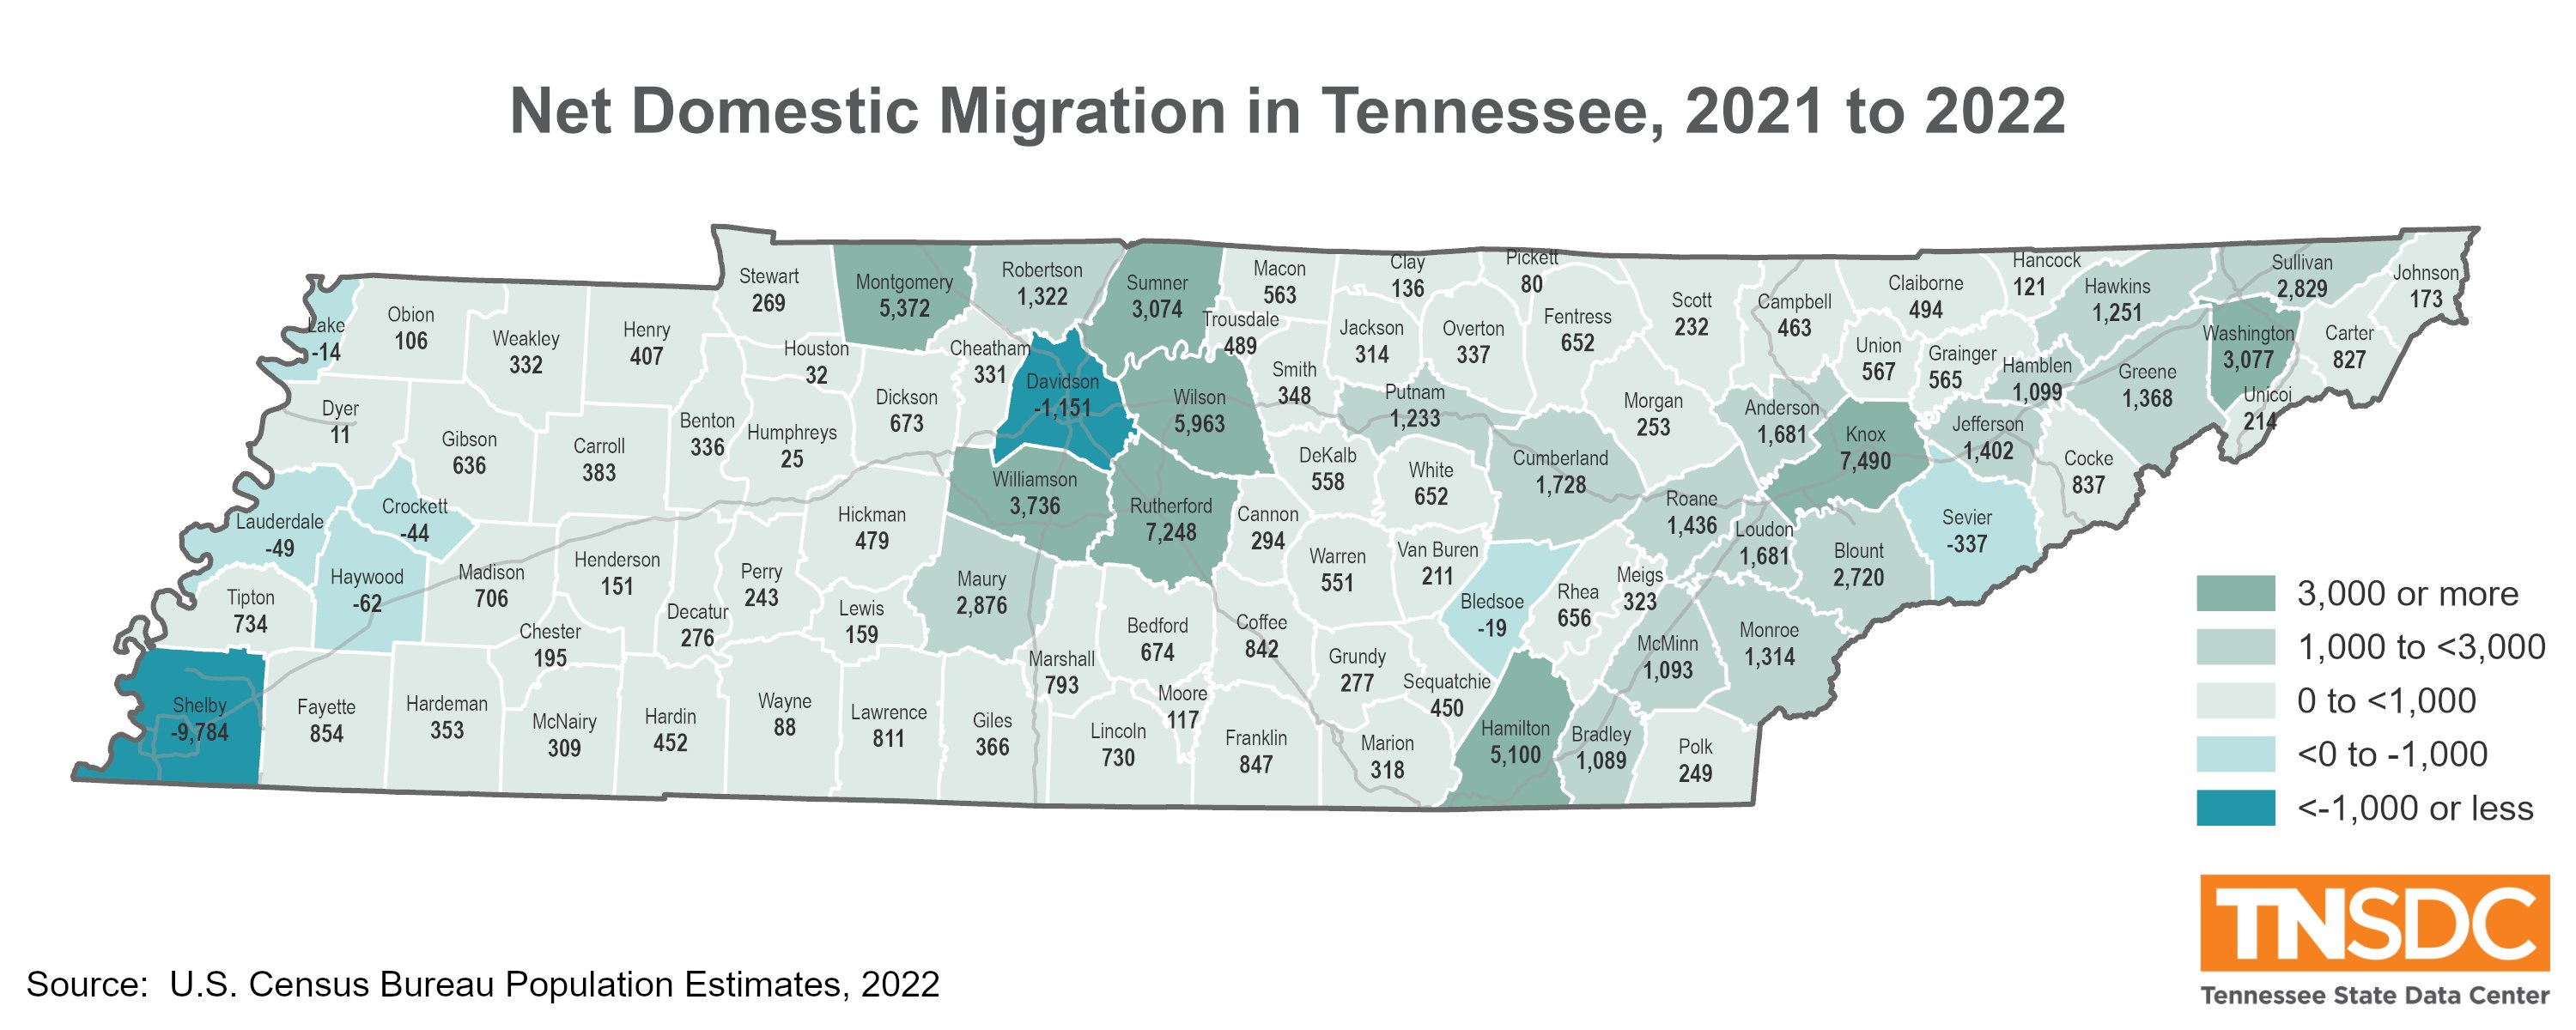
Figure 2: Net domestic migration measures the difference between people moving into a county and people moving out of a county. Only eight of Tennessee 95 counties had negative net migration last year, which is well below recent trends.
The state’s two largest counties, Shelby and Davidson, have sustained consecutive years with net domestic migration decreases. That leaves the state’s two largest counties below their 2020 Census mark.
Most Rural County Growth Rates Pick Up in 2022
In 2022, growth accelerated in 68 of Tennessee’s 78 rural counties compared to the prior year. That was among the numbers signaling that last year’s strong net domestic migration gains were widespread across the state.
In aggregate, rural counties in Tennessee grew at 0.9 percent in 2021 and then added another 1.4 percent in 2022. This was a sizeable jump as rural counties had averaged a 0.8 percent annual growth rate since 2017.
Wilson County’s 4.3 percent increase was the fastest growing; not just among rural counties, but all counties in Tennessee. Trousdale and Maury counties, which are also part of the 13-county Nashville Metropolitan Statistical Area, rounded out the top three fastest-growing areas.
| County | 2021 Population | 2022 Population | Change | Percent Change |
| Wilson County | 152,010 | 158,555 | 6,545 | 4.3% |
| Trousdale County | 11,619 | 12,111 | 492 | 4.2% |
| Maury County | 105,003 | 108,159 | 3,156 | 3.0% |
| Sequatchie County | 16,445 | 16,909 | 464 | 2.8% |
| Fentress County | 18,837 | 19,332 | 495 | 2.6% |
| DeKalb County | 20,478 | 21,003 | 525 | 2.6% |
| Perry County | 8,473 | 8,685 | 212 | 2.5% |
| Van Buren County | 6,277 | 6,429 | 152 | 2.4% |
| Marshall County | 35,032 | 35,878 | 846 | 2.4% |
| Monroe County | 46,668 | 47,740 | 1,072 | 2.3% |
Source: Vintage 2022 Population Estimates, U.S. Census Bureau, 2023
Most of the other fast-growing rural counties are sprinkled across the other eastern two-thirds of the state. Sequatchie, Van Buren and Marshall counties have shown consistent increases over the past several years.
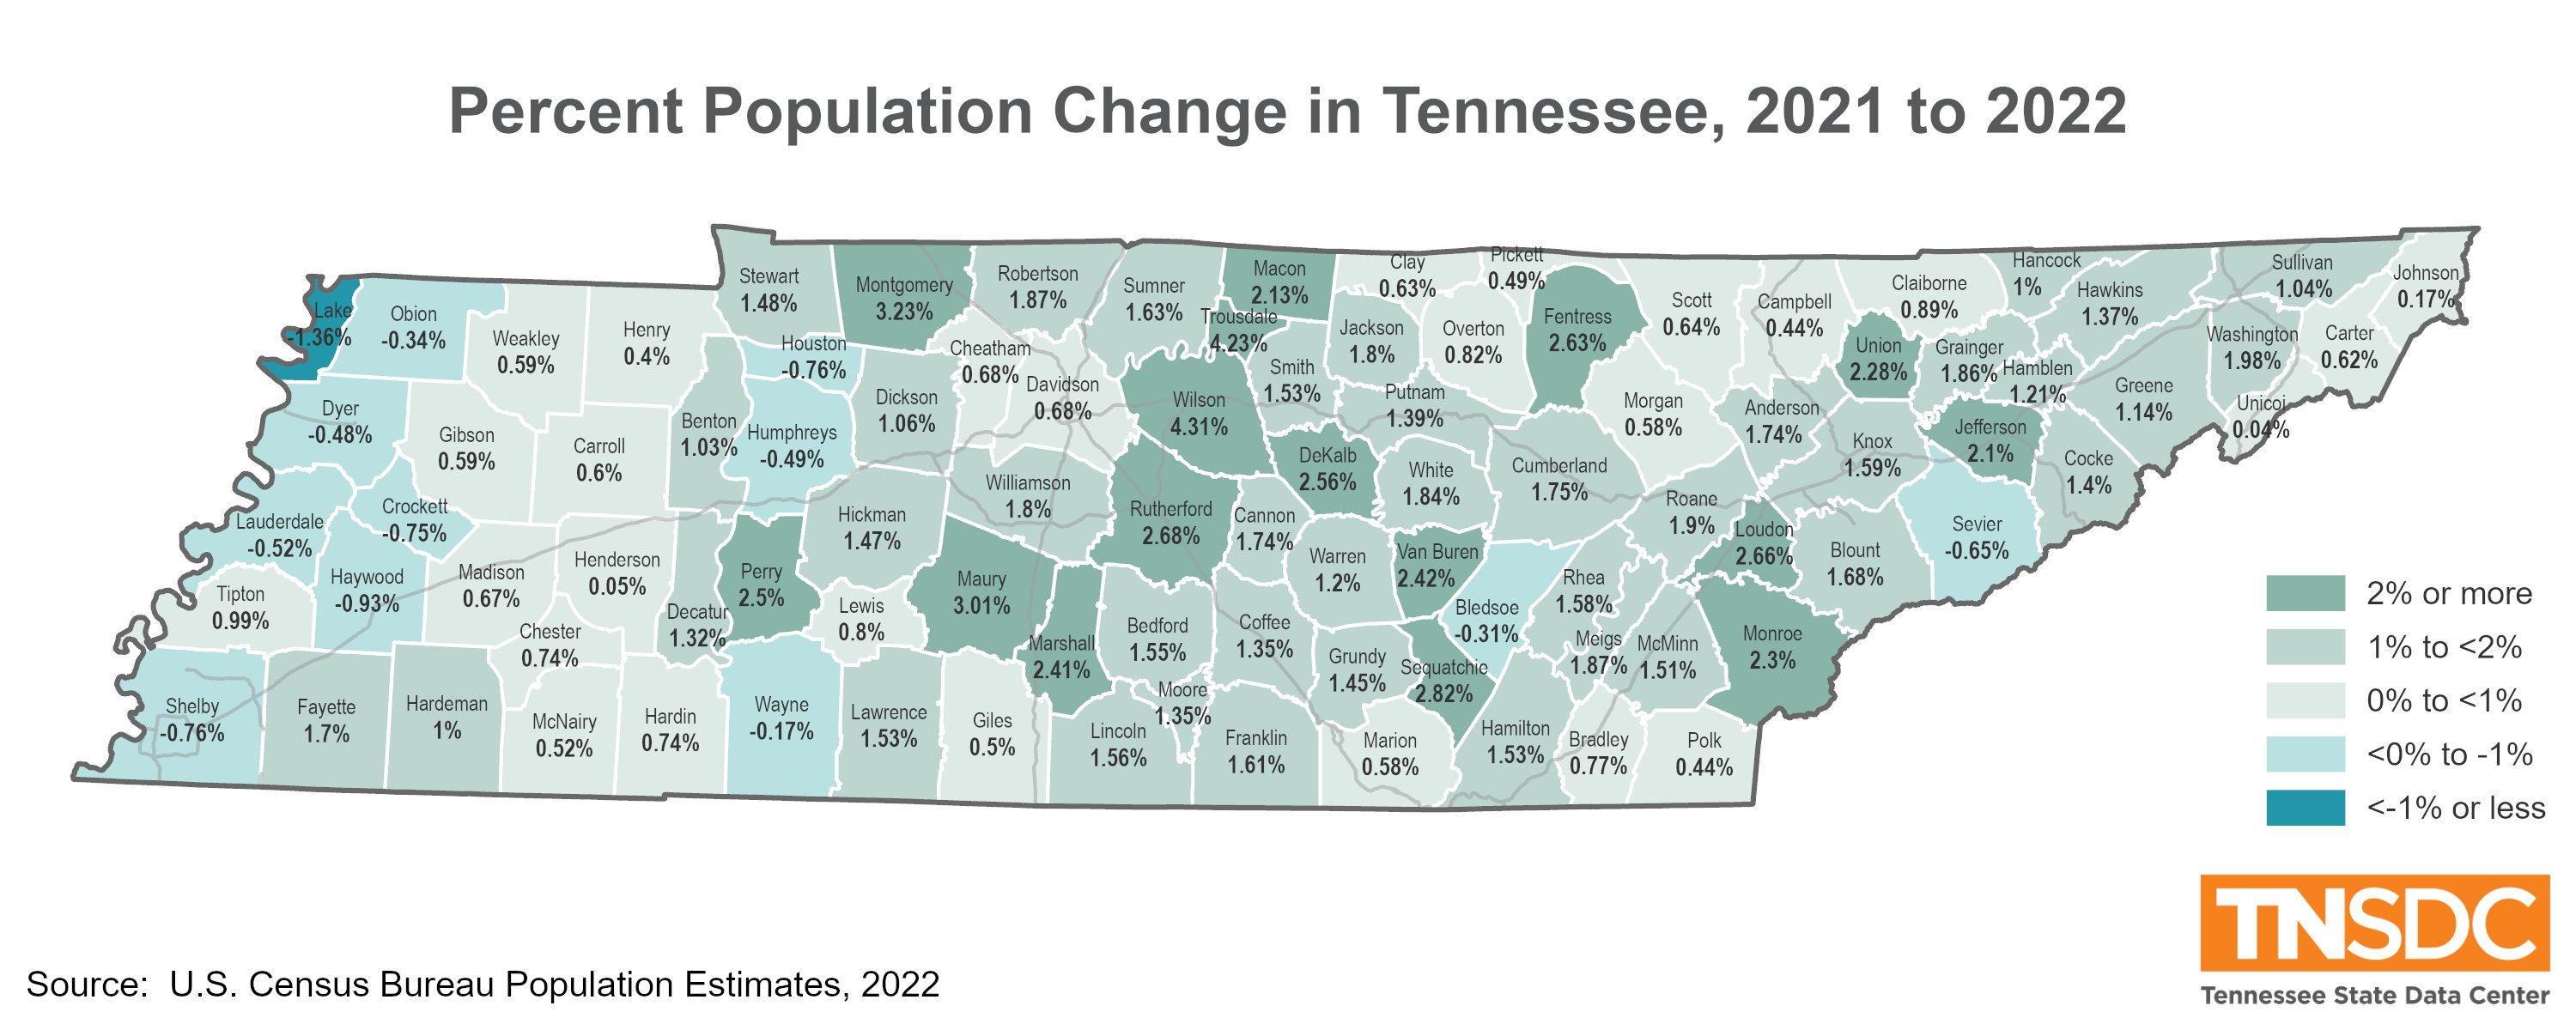
Figure 3: Percent population change from 2020 to 2021 shows that 17 Tennessee counties in the eastern two-thirds of the state had a one-year population increases of more than 2 percent. Thirteen of those counties were rural.
Reprieve from Rural Population Declines
Another remarkable break so far this decade is the reduced number of rural counties in Tennessee experiencing population decline. Between decennial censuses in 2010 and 2020, 30 counties in the state lost population. Only one of those, Carter County in Northeast Tennessee, is considered urban. The remaining 29 were classified as rural by the Tennessee Department of Economic and Community Development.
But so far this decade, population declines have been seen in just nine rural counties.
The slowing of rural population decreases is entirely attributable to the elevated levels of domestic migration the state is experiencing. In fact, 75 of 78 rural counties in Tennessee saw a natural population decrease in 2022 – more deaths than births. That also means a slowdown in the domestic migration component, which historically has shown to be cyclical, could tip some rural areas back into population decline.
| County | ECD Urban/Rural Status | 2020 Population | 2022 Population | Change Since 2020 Census |
|---|---|---|---|---|
| Shelby | Urban | 929,722 | 916,371 | -13,351 |
| Davidson | Urban | 715,875 | 708,144 | -7,731 |
| Lake | Rural | 7,004 | 6,507 | -497 |
| Obion | Rural | 30,788 | 30,394 | -394 |
| Dyer | Rural | 36,803 | 36,410 | -393 |
| Lauderdale | Rural | 25,139 | 24,793 | -346 |
| Haywood | Rural | 17,862 | 17,550 | -312 |
| Unicoi | Rural | 17,924 | 17,674 | -250 |
| Bledsoe | Rural | 14,916 | 14,798 | -118 |
| Houston | Rural | 8,281 | 8,219 | -62 |
| Crockett | Rural | 13,909 | 13,888 | -21 |
Source: Vintage 2022 Population Estimates, U.S. Census Bureau, 2023
Bledsoe County, located just north of Chattanooga, was among those rural counties with smaller population decline last year. Although the household population in this rural county has grown, a smaller prisoner population at the Bledsoe County Correctional Facility has kept the county’s overall population change in negative territory.
That was not the case for Lake and Lauderdale counties in West Tennessee, which also hold large state correctional facilities. While both counties have seen prison populations shrink slightly, they also had decreases in their household population.
The Census Bureau’s county-level population estimate data are released annually in March. In May, additional 2022 data will be released covering population and housing unit estimates for incorporated places. That will be followed by estimates of age, race, sex and Hispanic origin for the nation, states and counties in June.
More Resources

Check out our ready-to-print population estimate reference sheets for states, Tennessee counties, cities and towns. They include data from the 2010, 2020 decennial censuses and the most recent information from the population estimates program.
Download PDFs