
Recent articles from Census Bureau researchers have highlighted some important trends in the state.
We took a closer look at a few of these articles and recap what they can tell us about the state of Tennessee.
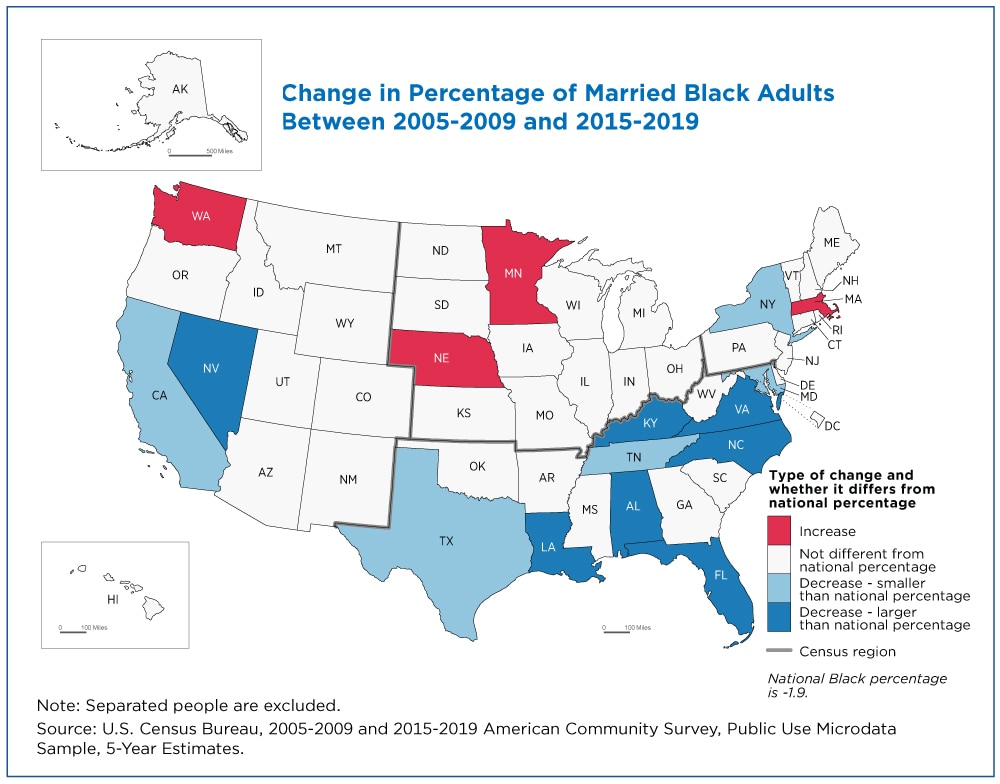
Declining Marriage Rates Vary by Race
New research featured in a July 2022 story in America Counts noted some interesting differences in marital trends among racial groups, chiefly being the increasing rates of unmarried Black or African Americans in the country. The article notes that by 2020, 51.4 percent of Black men and 47.5 percent of Black women were never married. For all groups in 2020, those rates were 35.8 percent and 30 percent respectively.
The report shows that in Tennessee, the growth in unmarried Black or African Americans adults in Tennessee was slower than the national average, but since 2017 has exceed 50 percent of the group’s total. 2019 American Community Survey data showed that for the state as a whole, 30.2 percent of residents had never been married; a difference of 20 percentage points.
| Marital status | Total | White | Black or African American | American Indian and Alaska Native | Asian | Native Hawaiian and Other Pacific Islander | Some Other Race | Two or More Races | Hispanic or Latino |
|---|---|---|---|---|---|---|---|---|---|
| Never Married | 30.2% | 25.0% | 50.3% | 26.2% | 29.1% | 39.9% | 53.7% | 48.5% | 39.6% |
| Currently Married | 49.1% | 53.6% | 28.4% | 44.6% | 60.7% | 31.6% | 34.7% | 33.4% | 48.7% |
Source: 2015-2019 5-year ACS Public Use Microdata Sample, US Census Bureau.
That same data showed that the share of non-Hispanic Whites, American Indians and Alaska Natives, and Asians in the state had lower rates of people who were never married than the statewide figure.
Almost 40 percent of Hispanics or Latinos, the state’s third largest racial/ethnic group, has never been married.
Teen-to-Adult Migration Patterns Show Most Young Adults Remain in State (July 2022)
81 percent of 16-year-old Tennesseans still lived in the state at age 26, according to new Harvard/Census Bureau research which focused on a group born between 1984 and 1992. Across the state, 70 percent still resided within the same multi-county “commuting zone” that they did as a child – a level matching national-level trends showing most young adults remain close to home. An interactive map found at migrationpatterns.org provides additional detail, including tools to show the effect of parent’s race and income on migration patterns.
| Commute Zone | Within Same Commute Zone | Elsewhere in Tennessee | Different State |
|---|---|---|---|
| Chattanooga | 71.8% | 8.9% | 19.3% |
| Clarksville | 58.3% | 10.0% | 31.7% |
| Cleveland | 69.2% | 15.5% | 15.3% |
| Columbia | 61.5% | 19.6% | 18.9% |
| Cookeville | 65.7% | 19.0% | 15.3% |
| Crossville | 63.5% | 22.2% | 14.3% |
| Dickson | 59.5% | 24.2% | 16.3% |
| Dyersburg | 59.3% | 25.5% | 15.2% |
| Jackson | 62.1% | 21.7% | 16.2% |
| Johnson City | 74.9% | 6.7% | 18.4% |
| Knoxville | 72.2% | 10.2% | 17.5% |
| Lexington | 61.8% | 24.1% | 14.1% |
| McMinnville | 64.8% | 24.0% | 11.3% |
| Memphis | 74.1% | 5.3% | 20.6% |
| Middlesborough | 64.3% | 14.2% | 21.5% |
| Morristown | 64.3% | 19.8% | 15.9% |
| Nashville | 73.0% | 8.3% | 18.7% |
| Tullahoma | 63.1% | 20.6% | 16.2% |
| Union City | 60.0% | 15.3% | 24.6% |
Source: Source: Ben Sprung-Keyser, Nathaniel Hendren, Sonya Porter, 2022. “The Radius of Economic Opportunity: Evidence from Migration and Local Labor Markets.” CES Working Paper #22-27.
2019 Survey Shows Continued Generational Wealth Concentration (August 2022)
The Census Bureau’s Survey of Income and Program Participation (SIPP) captures the details household assets and liabilities among other employment and income measure. An analysis of 2019 SIPP data highlighted some persistent inequality trends related to wealth:
- 2 percent of households don’t own a retirement account
- Homeowners had a median wealth of $305,000, versus $4,084 among those who rented
- Net worth of married households was five to seven times higher than unmarried male and female households
The article’s headline spotlighted wealth concentration among the “Baby Boomer” generation (born 1946 to 1964) which was about nine times that of the “Millennial” group (born 1981 to 1986).